


Bitcoin logo on smartphone with price chart in background. Source: TechGaged / Shutterstock
Bitcoin Spot Demand Turns Positive Again, Breaks Multi-Month Downtrend
In Brief
- • Bitcoin spot demand has turned positive again.
- • On-chain data suggests buyers are absorbing supply.
- • Early signal, but not a confirmed trend reversal.
Ad
Bitcoin (BTC) spot demand is showing signs of recovery after months of weakness. According to new on-chain data, demand has started rising again for the first time since late November. The shift is drawing attention as analysts look for early signals of market momentum.
A Notable Shift In Demand Dynamics
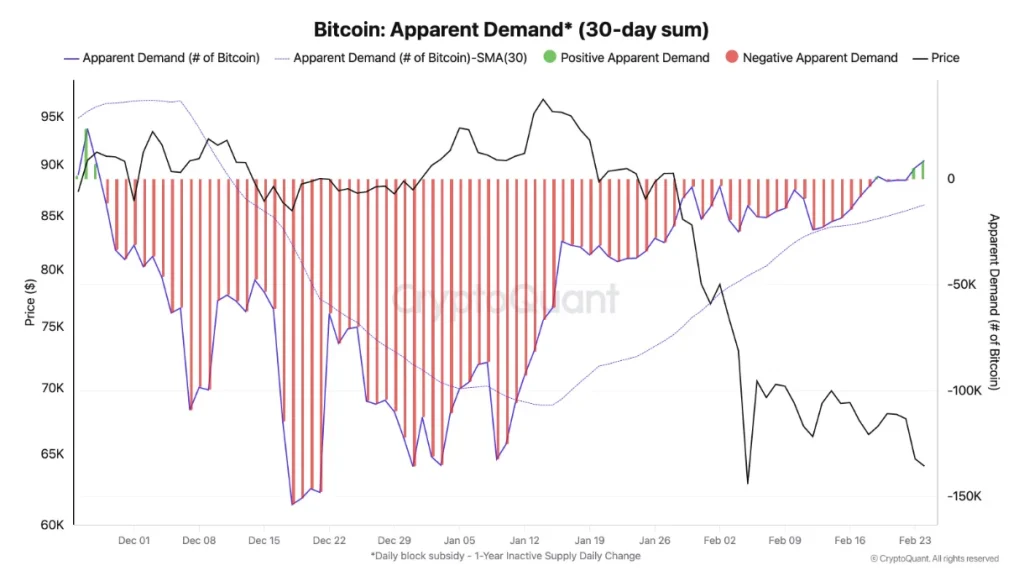
In an X post shared on February 25, CryptoQuant’s head of research Julio Moreno highlighted that apparent demand, a metric tracking new supply absorption, has recently turned positive. The indicator compares newly mined Bitcoin with changes in inactive supply, offering insight into whether fresh capital is entering the market.
For several months, the metric had remained in negative territory, reflecting subdued spot buying and cautious sentiment. The recent flip suggests buyers may once again be absorbing supply rather than letting coins circulate back into the market.
Charts shared alongside the commentary show improving demand trends across recent weeks, with momentum gradually stabilizing after a prolonged downtrend.
Why Spot Demand Matters
Spot demand is closely watched because it reflects organic market participation rather than derivatives-driven activity. When demand strengthens at the spot level, it often indicates accumulation rather than short-term speculation.
Historically, sustained recoveries in demand metrics have coincided with periods of price stabilization or trend reversals. Analysts often combine these signals with exchange flows, exchange-traded fund (ETF) activity, and long-term holder behavior to assess broader market direction.
At the same time, early shifts in demand don’t automatically signal a new bull phase. On-chain indicators typically evolve gradually and can reverse if macro conditions weaken or selling pressure returns.
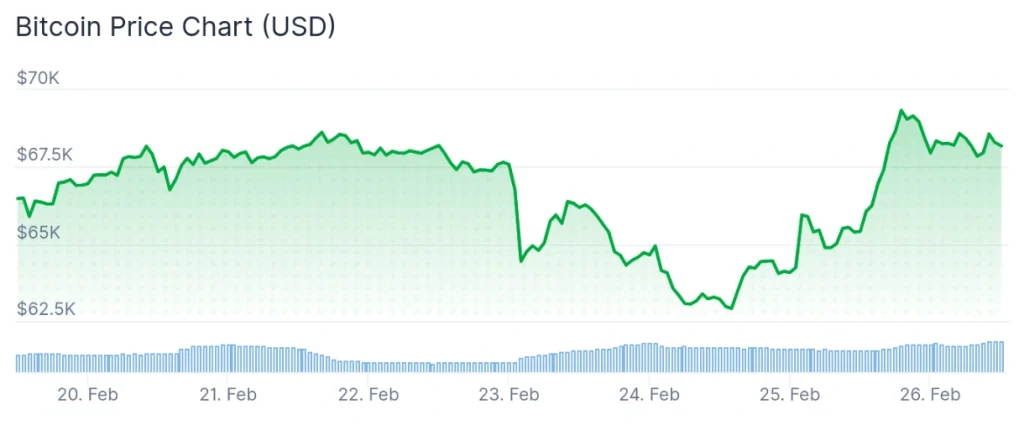
Meanwhile, Bitcoin was at press time trading at $68,208.30, indicating a 4.2% gain on the day and an increase of 2.1% across the week, as it decreases its loss accumulated over the past month to 22.2%, according to the most recent price chart information.
All things considered, the return of positive demand marks a notable change after months of softness. As Bitcoin navigates a shifting market environment, signals like this are increasingly watched for clues about whether underlying accumulation is quietly rebuilding beneath the surface.
More Must-Reads:
How do you rate this article?
Subscribe to our YouTube channel for crypto market insights and educational videos.


Join our Socials
Briefly, clearly and without noise – get the most important crypto news and market insights first.
Most Read Today
1
The “Jane Street 10 AM” Narrative Meets a $68,000 Bitcoin Rally
2Ripple CTO Pushes Back On Centralization Accusations
3TD Cowen Analyst Makes Bullish Bitcoin Case: ‘Stronger, Cheaper Than Ever’
4U.S. Midterms Could Drive Crypto Cycle, Analyst Says
5Traders Are More Afraid Now Than During Past Crashes, Here’s Why
Latest


8
Also read
Similar stories you might like.

Bitcoin
Bitcoin Rights Bill Clears Indiana Legislature; Here’s What It Means
Ana | 2026-02-26

Altcoins
Ethereum Outlines Bold Vision In Its 10-Year ‘Strawmap’ – What It Includes
Ana | 2026-02-26

Industry
Regulator Drafts GENIUS Act Implementation Proposal, Seeks Public Comment
Ana | 2026-02-26

Bitcoin
‘How To Buy Bitcoin’ Searches Spike To 5-Year High As Interest Returns
Ana | 2026-02-26

Bitcoin
The “Jane Street 10 AM” Narrative Meets a $68,000 Bitcoin Rally
Patrick | 2026-02-25
Bitcoin
Traders Are More Afraid Now Than During Past Crashes, Here’s Why
Patrick | 2026-02-25

Bitcoin
TD Cowen Analyst Makes Bullish Bitcoin Case: ‘Stronger, Cheaper Than Ever’
Ana | 2026-02-25

Bitcoin
Rare Solo Bitcoin Mining Win Happens Again: $200K on $75 Equipment
Ana | 2026-02-25
Defi
Mastercard Expands Crypto Push With New Web3 Role
Ana | 2026-02-25

Altcoins
Ripple CTO Pushes Back On Centralization Accusations
Ana | 2026-02-25