


Bitcoin logo screen. Source: TechGaged / Shutterstock
BTC Stress Signal Flashing Again; Here’s What It Says
In Brief
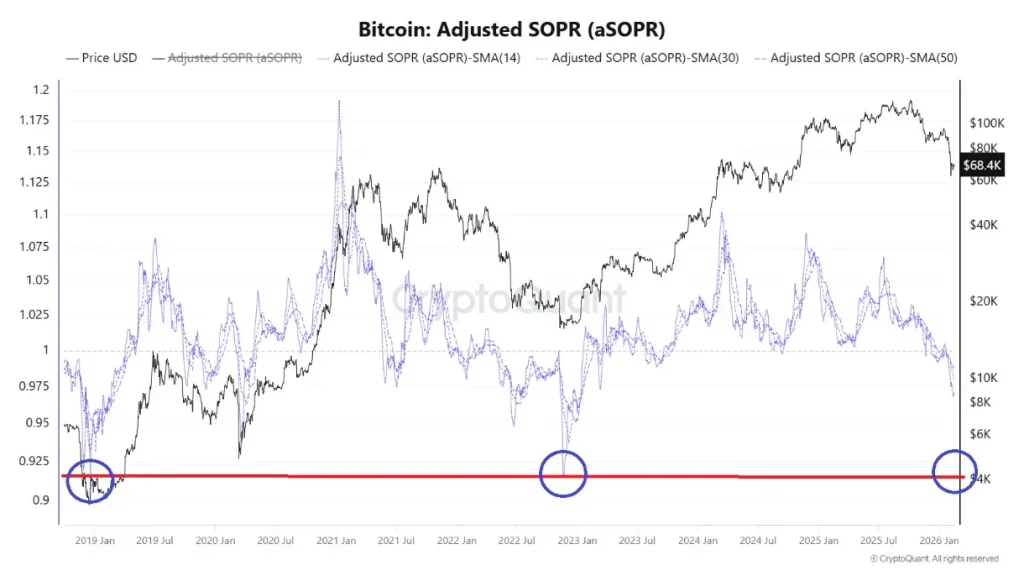
- • Bitcoin aSOPR dropped to ~0.92–0.94, a historic stress zone.
- • Past readings aligned with deep corrections or bear phases.
- • Key signal: reclaim 1.0 or risk broader downturn.
Bitcoin (BTC)’s adjusted SOPR has fallen back into the 0.92-0.94 zone, a level historically linked to bear market stress. Analysts note that similar readings appeared during deep corrective phases in 2019 and 2023. The signal suggests BTC may be transitioning from a correction into a broader structural downturn.
What The Data Shows
The Adjusted Spend Output Profit Ratio (aSOPR) measures whether coins are being spent at a profit or loss.
The key takeaways from the current Bitcoin reading, shared by CryptoQuant’s analyst Woo Minkyu on February 16, include aSOPR below 1.0 (coins moving at a loss), multiple cycle lows historically forming near 0.92-0-93, and the current reading equal to a return to prior capitulation zones.
In both 2019 and 2023, dips into this range aligned with heavy loss realization and macro bottoms forming later. Unlike short-term corrections where aSOPR quickly rebounds above 1.0, this move shows prolonged compression, which is a sign of weakening market structure.
Why This Matters For Crypto Traders
aSOPR is widely used to identify market regimes, including a bullish profit-taking environment at above 1.0, neutral consolidation near 1.0, and loss realization and stress at below 1.0
If BTC fails to reclaim 1.0 soon, analysts warn that the probability rises that the market is entering a deeper bear phase rather than a simple pullback. Historically, durable bottoms tend to form only after extended SOPR compression, capitulation spikes, and seller exhaustion.
Current readings suggest stress is building, but may not yet represent full capitulation.
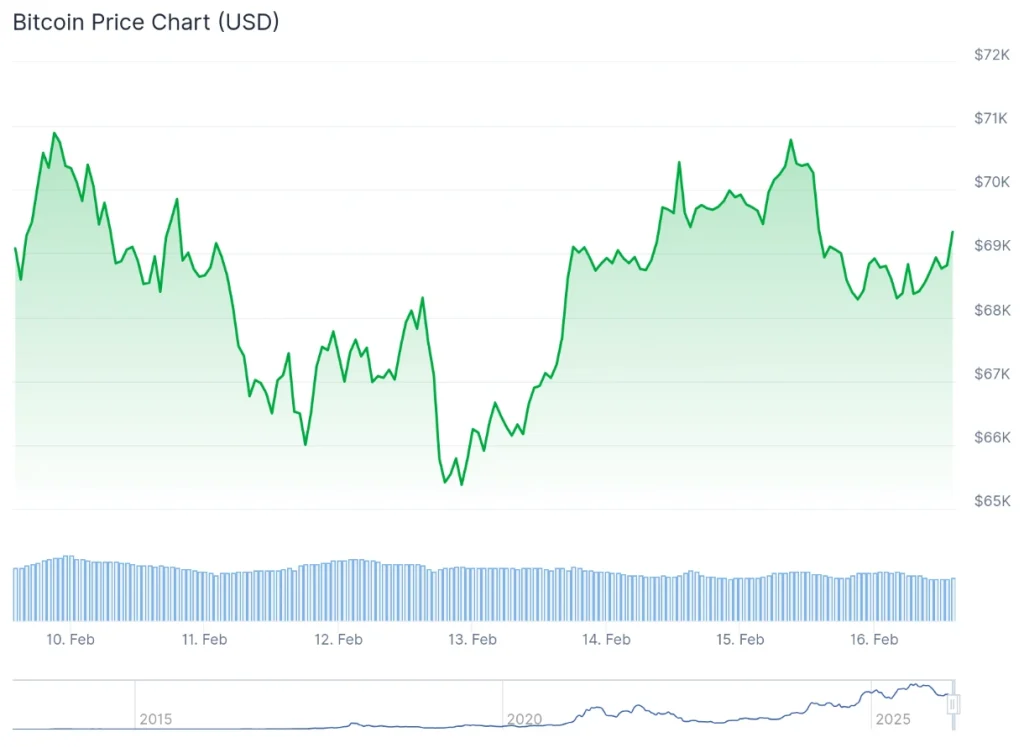
Bitcoin is now trading at a price of $68,852.57, indicating a 1.2% drop on the day, an increase of 0.4% over the week, and a 27.1% dip across the past month, per the latest chart data.
What Happens Next
In a bearish scenario, aSOPR remains below 1.0, loss realization continues, and there is prolonged consolidation or macro downtrend. In a bullish case, Bitcoin rapidly reclaims 1.0, makes a reset similar to mid-cycle dips, and recovers faster in sentiment.
Analysts emphasize that timing matters, as previous bear transitions unfolded over months, not weeks.
Bottom Line
Bitcoin’s aSOPR has entered a historically dangerous zone. Though not yet signaling final capitulation, the metric suggests structural deterioration beneath the surface. For traders, the key signal now is whether SOPR can reclaim profitability, or if this marks the early stages of a broader bear regime.
BTC Price Today
More Must-Reads:
How do you rate this article?
Join our Socials
Briefly, clearly and without noise – get the most important crypto news and market insights first.
Most Read Today
1
60,000 GPUs on the Line: Could Render’s RNP-023 Ignite a Supply Crunch?
2Coinbase Lands OCC Approval in Major U.S. Crypto Shift
3Ripple’s Brokerage Arm Lands Investment-Grade Rating as Expansion Continues
4NEAR Horizon: Is the Ecosystem Ready for the Next Wave of Mass Adoption?
5TAO Subnet Reality Check: Revenue vs. Subsidies – What Investors Must Know After the Rally
Latest


8
Also read
Similar stories you might like.

Bitcoin
Bitcoin Consolidation Continues as Market Signals Rising Volatility; What’s Next?
Ana | 2026-04-03

Industry
Two More U.S. States Grant DAOs Legal Recognition
Ana | 2026-04-03

Defi
Coinbase Lands OCC Approval in Major U.S. Crypto Shift
Ana | 2026-04-03

Defi
CFTC Sues Arizona, Illinois, Connecticut for Blocking Prediction Markets
Rokas | 2026-04-03

Altcoins
60,000 GPUs on the Line: Could Render’s RNP-023 Ignite a Supply Crunch?
Azeez | 2026-04-03

Defi
Ripple’s Brokerage Arm Lands Investment-Grade Rating as Expansion Continues
Rokas | 2026-04-03

Altcoins
NEAR Horizon: Is the Ecosystem Ready for the Next Wave of Mass Adoption?
Azeez | 2026-04-03

Defi
Major EU Bank CaixaBank Moves Into Crypto Under MiCA
Ana | 2026-04-02

Blockchain
Solana-Based Drift Protocol Halts Operations After Security Breach; What Happened?
Ana | 2026-04-02

Industry
Iran Demands Crypto, Yuan Fees For Passage Through Hormuz
Ana | 2026-04-02