


Bitcoin standing on top of two coins with a bullish trend showing in the back. Source: TechGaged / Shutterstock
Bitcoin Correction Echoes Past Cycles as Relief Rally Hopes Rise
In Brief
- • Bitcoin’s drop is being compared to past cycle corrections rather than a confirmed trend shift.
- • Traders are watching for signs of a possible short-term rebound.
- • Market structure still suggests caution as volatility remains elevated.
Ad
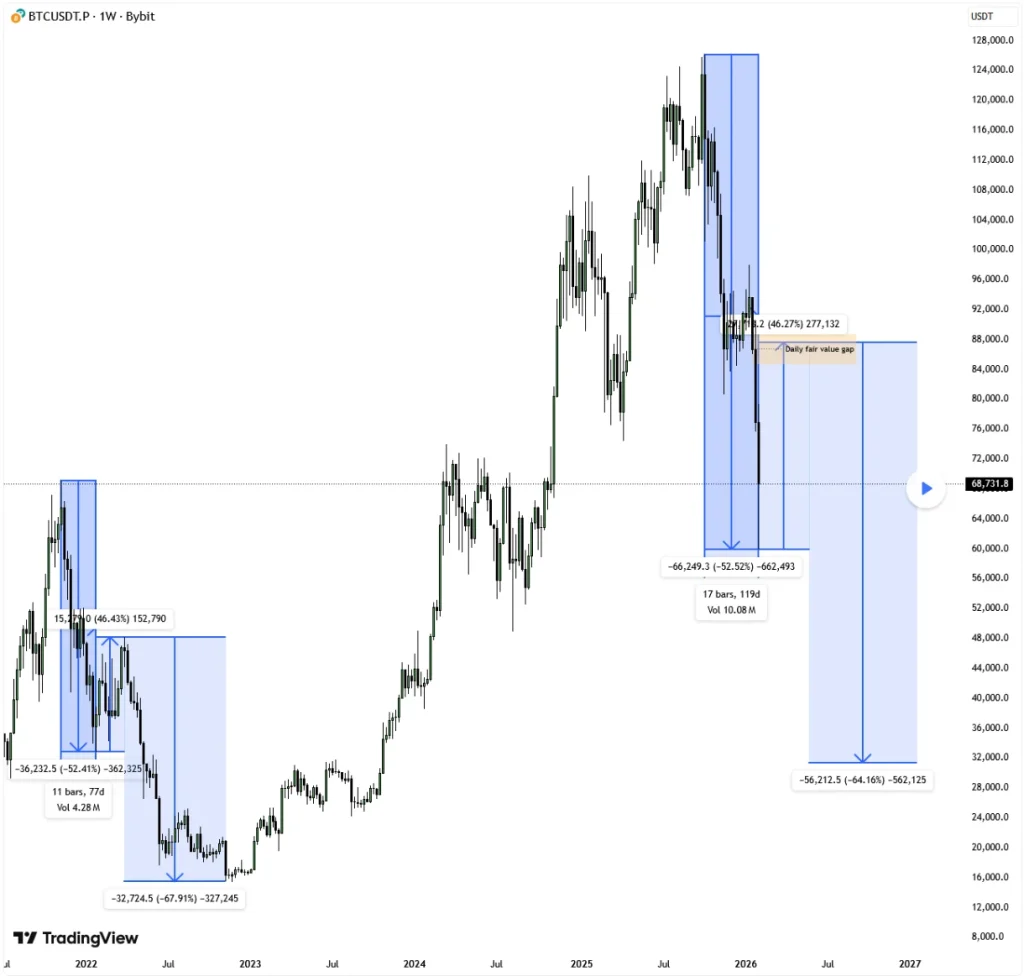
Bitcoin’s (BTC) latest major price slump is drawing comparisons to past market cycles, with analysts pointing to a roughly 52% decline from recent highs—a level historically associated with mid-cycle corrections rather than full trend reversals.
A chart published on February 6 by professional trader TehThomas has gained traction among market participants for highlighting structural similarities between the current correction and Bitcoin’s 2021 mid-term bear phase.
The analysis suggests that while volatility remains elevated, the broader market context may reflect cyclical positioning rather than widespread capitulation.
Market Structure Echoes Previous Cycle Behavior
Bitcoin has repeatedly exhibited cyclical price behavior, with deep corrections often serving as a foundation for subsequent expansions. During the previous bull market, the asset retraced about 52% before stabilizing and eventually resuming its upward trajectory.
The current pullback from the 2025 all-time high appears to closely mirror that structure, reinforcing the view among some traders that the market is undergoing a structurally healthy retracement.
Although historical comparisons do not guarantee identical outcomes, recurring patterns remain a core component of technical market analysis.
Focus Turns to Potential Relief Rally
Market attention is increasingly shifting toward the possibility of a relief rally following the sharp decline. In the previous cycle, Bitcoin rebounded roughly 46% after establishing a mid-term low, a move that helped rebalance liquidity before the next phase of price action unfolded.
If a similar rebound were to develop now, traders suggest Bitcoin could move toward a Daily Fair Value Gap (FVG) created during the recent selloff. Fair Value Gaps are commonly viewed by technical analysts as areas where price may return to rebalance order flow after rapid directional moves.
Such a recovery would align with classic crypto-cycle behavior, in which strong rebounds often follow capitulation-style declines.
The Daily FVG above current price levels is emerging as a focal point for traders monitoring short-term momentum. These imbalance zones are frequently revisited as markets seek equilibrium after periods of aggressive buying or selling.
Acceptance above the gap could indicate strengthening bullish momentum, while rejection may reinforce the narrative that Bitcoin remains within a broader corrective phase.
Analysts stress that how price behaves inside this region could shape sentiment across derivatives and spot markets in the coming weeks.
Downside Risk Still in Play Despite Structural Support
Despite growing discussion around a potential rebound, traders caution that mid-cycle corrections rarely resolve in a single move.
Historical patterns indicate that Bitcoin often forms complex consolidation structures, characterized by alternating rallies and pullbacks before establishing a definitive bottom.
Within this framework, a rejection from overhead resistance could expose lower-liquidity zones, with some technical indicators identifying the $34,000 area as a possible higher-timeframe accumulation region.
Such a sequence—capitulation, a relief rally, followed by a secondary decline—has appeared in prior market cycles and is often viewed as characteristic of mid-cycle bear markets rather than full macroeconomic reversals.
For now, the 52% correction level is being watched as a potential inflection point. While analysts remain cautious about predicting immediate upside, the historical symmetry highlighted in recent chart analyses reinforces the view that Bitcoin’s long-term cycle structure may remain intact.
As volatility persists, traders are likely to monitor liquidity zones and imbalance levels closely, with relief rallies and sharp pullbacks both remaining plausible scenarios in the near term.
More Must-Reads:
- Bitcoin Structure Suggests Four-Year Cycle Still Has Room
- Bitcoin, Ethereum Hit Fear Extremes While XRP Defies Crowd
- 3 Things That Need to Happen for Bitcoin to Bounce Back
Bitcoin Price Now:
How do you rate this article?
Subscribe to our YouTube channel for crypto market insights and educational videos.


Join our Socials
Briefly, clearly and without noise – get the most important crypto news and market insights first.


8
Also read
Similar stories you might like.

Industry
Trump Backs Bitcoin, Stablecoins In New Pro-Crypto Push
Ana | 2026-03-30

Industry
Canada Proposes Ban on Crypto Political Donations
Ana | 2026-03-30

Altcoins
Ethereum Foundation Makes Record ETH Staking Move
Ana | 2026-03-30

Bitcoin
Bitcoin Miners Turn to AI as Profits Collapse
Ana | 2026-03-30

Bitcoin
Mystery Deepens as $400M ‘Lost’ Bitcoin Suddenly Moves
Rokas | 2026-03-30

Altcoins
Kiyosaki Warns of Inflation Crisis, Lists 6 Safest Investments for 2026
Rokas | 2026-03-30

Altcoins
TRON Moves Toward Institutions: How Anchorage Support Could Influence TRX Price
Azeez | 2026-03-29
Altcoins
Gold Enters DeFi: Tether’s XAUt Expansion to BNB Chain Could Shift Market Dynamics
Azeez | 2026-03-29

Altcoins
Sui Approaches 800K Users as Token Unlock Nears — Can Price Stay Resilient?
Azeez | 2026-03-29

Altcoins
Could SpaceX’s IPO Be the Catalyst That Sends Dogecoin Above $0.10?
Azeez | 2026-03-29