


Bitcoin enters a high-risk chart zone as volatility and downside threats grow.
Bitcoin Is Entering Its Most Dangerous Chart Phase
In Brief
- • Bitcoin has fallen below a key long-term weekly support level.
- • Similar breakdowns in past cycles led to deeper corrections.
- • Traders are watching for stabilization or continued downside.
Bitcoin (BTC) has crossed a chart line that has historically separated routine pullbacks from deeper macro corrections, with a weekly close below the 100-week simple moving average (SMA) often marking the start of accelerated and dangerous downside.
As it happens, this time appears no different, at least on the chart shared by popular crypto trading specialist Ali Martinez in an X post on February 3. Now traders are waiting to see if Bitcoin stabilizes quickly or follows the same path seen in past cycles.
What The Weekly Chart Is Showing
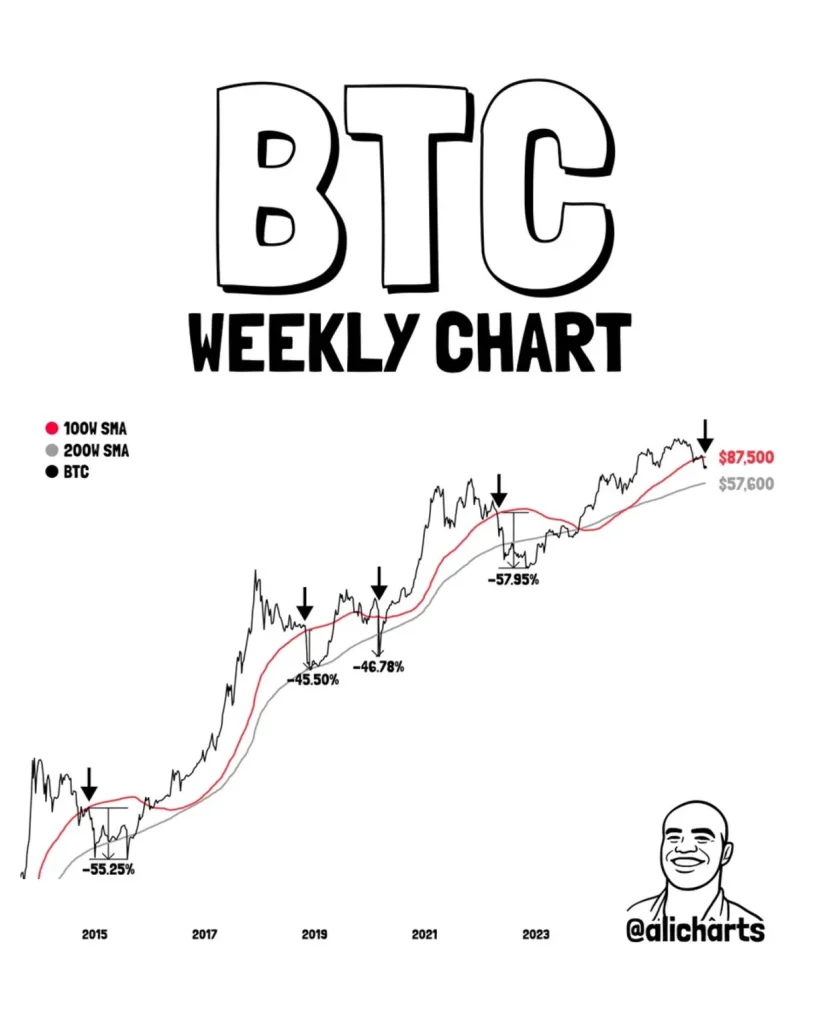
According to the long-term weekly chart posted by Martinez, Bitcoin has once again closed below its 100-week SMA, a level that has acted as macro support across multiple cycles.
Since 2015, every sustained loss of this average has led to a move lower toward the 200-week SMA. In previous instances, Bitcoin failed to reclaim the 100-week level quickly and instead entered a sharp corrective phase.
History shows a consistent pattern, where BTC fell roughly 55% after losing the 100-week average in 2014, the 2018 breakdown that led to a 45% decline over about a month, the rapidly unfolding move during the 2020 COVID shock that saw a 47% drop in about a week, and the same signal preceding a 58% decline lasting close to seven weeks in 2022.
When this level fails, volatility tends to expand.
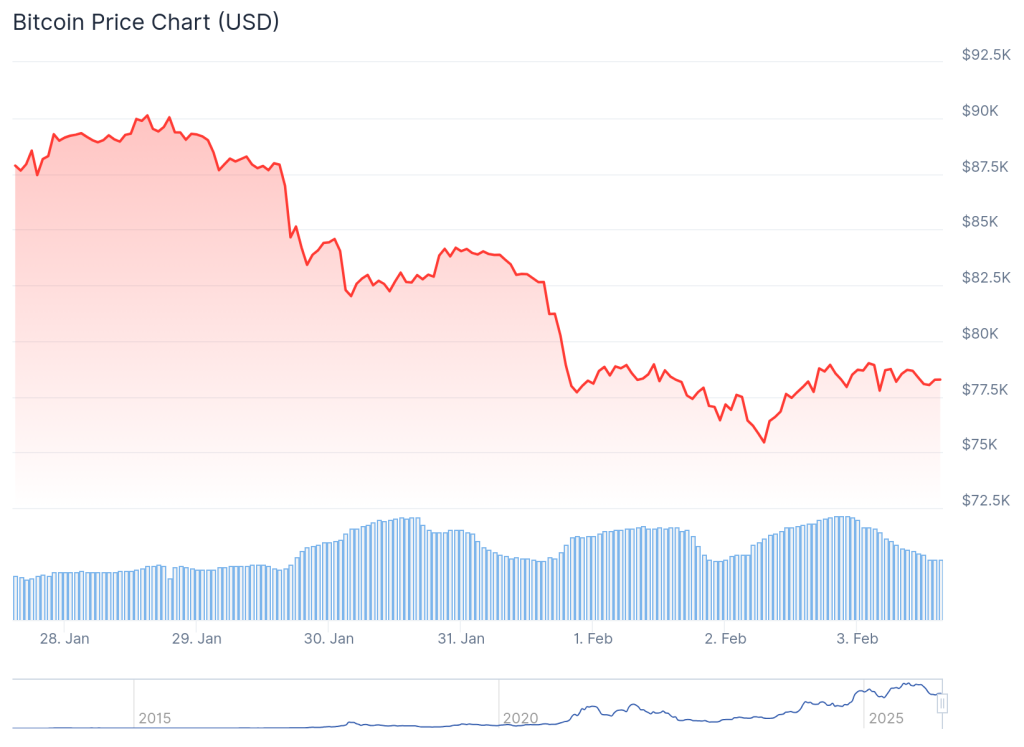
Meanwhile, the price of Bitcoin currently stands at $78,270.52, indicating a 0.5% increase on the day, but at the same time a drop of 10.9% across the week, and a 14.2% loss over the past month, per the most recent charts.
Why This Pattern Demands Attention
The 100-week and 200-week averages are widely watched by long-term investors, institutions, and systematic traders. Once Bitcoin moves below the 100-week line, positioning often shifts from accumulation to risk reduction.
If historical behavior repeats, downside pressure could persist until the price approaches the 200-week average, where longer-term demand has historically re-emerged. That transition phase has typically involved drawdowns in the 45%-58% range and played out over several weeks.
As Martinez said:
“If historical patterns repeat, this increases the probability of a ~50% drawdown toward the 200-week MA. Based on current levels, that projects a potential downside zone roughly between $56,000 and $50,000, which could happen by March or April.”
This doesn’t guarantee the same outcome. But from a macro perspective, Bitcoin has entered a zone where patience and confirmation matter far more than short-term noise.
Bitcoin Price Today
More Must-Reads:
How do you rate this article?
Subscribe to our YouTube channel for crypto market insights and educational videos.


Join our Socials
Briefly, clearly and without noise – get the most important crypto news and market insights first.
Most Read Today
1
How Accurate Are Robert Kiyosaki’s Predictions?
2TAO Subnet Reality Check: Revenue vs. Subsidies – What Investors Must Know After the Rally
3This Wall Street Giant Bought Crypto Firm Despite Market Slump
4RenderCon 2026 Preview: What the Upcoming Event Means for RENDER Price and Adoption
5Ripple’s Brokerage Arm Lands Investment-Grade Rating as Expansion Continues
Latest


8
Also read
Similar stories you might like.

Bitcoin
Bitcoin Consolidation Continues as Market Signals Rising Volatility; What’s Next?
Ana | 2026-04-03

Industry
Two More U.S. States Grant DAOs Legal Recognition
Ana | 2026-04-03

Defi
Coinbase Lands OCC Approval in Major U.S. Crypto Shift
Ana | 2026-04-03

Defi
CFTC Sues Arizona, Illinois, Connecticut for Blocking Prediction Markets
Rokas | 2026-04-03

Altcoins
60,000 GPUs on the Line: Could Render’s RNP-023 Ignite a Supply Crunch?
Azeez | 2026-04-03

Defi
Ripple’s Brokerage Arm Lands Investment-Grade Rating as Expansion Continues
Rokas | 2026-04-03

Altcoins
NEAR Horizon: Is the Ecosystem Ready for the Next Wave of Mass Adoption?
Azeez | 2026-04-03

Defi
Major EU Bank CaixaBank Moves Into Crypto Under MiCA
Ana | 2026-04-02

Blockchain
Solana-Based Drift Protocol Halts Operations After Security Breach; What Happened?
Ana | 2026-04-02

Industry
Iran Demands Crypto, Yuan Fees For Passage Through Hormuz
Ana | 2026-04-02